
Powering Your Cloud & Data Center Evolution
Building a data center is not what it used to be. Servers, VMs, networking fabrics-these are no longer…
Read More
PerfSONAR (performance Service-Oriented Network monitoring Architecture) is a network measurement toolkit that provides end-to-end network diagnostics over integrated network paths. It is an on-the-go issue...
PerfSONAR (performance Service-Oriented Network monitoring Architecture) is a network measurement toolkit that provides end-to-end network diagnostics over integrated network paths. It is an on-the-go issue detection system for network health based on various route diagnostic tools in its toolkit. It covers the essential L3 network connectivity testing tools, hosting protocols such as ICMP, OWAMP, TWAMP, and other methods such as traceroute and iperf. It also provides a uniform interface that allows for the scheduling of measurements, storage of data in uniform formats, and scalable ways to retrieve data and generate visualizations.
PerfSONAR allows scheduled tests to run on a regular basis or on demand, as required, from an interactive shell or from a GUI (PerfSONAR Web Admin). The test results can then be stored
locally or sent to a centralized server where the results from multiple hosts are aggregated to get a better view of the happenings in the network. The toolkit includes numerous utilities responsible for carrying out the actual network measurements and form the foundational layer of perfSONAR.
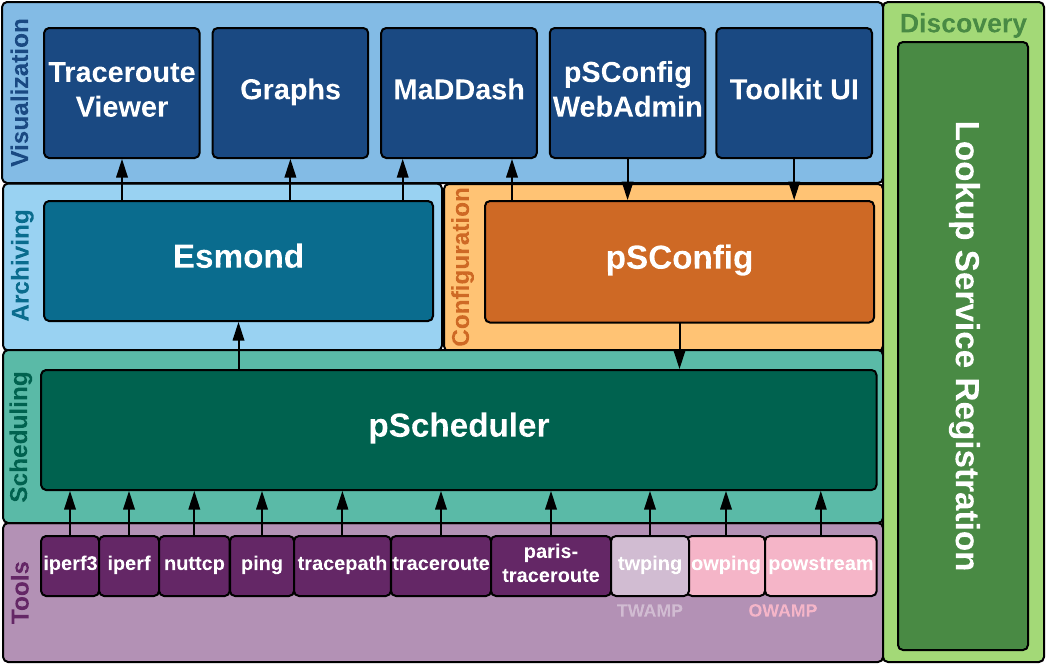
Figure 1 – perfSONAR architecture
In the architecture diagram (Figure 1) mentioned above, the key components have been outlined below:
An overview of supported tools –
The user has different installation options for different end devices such as centralized servers, clients, and servers. Here centralized server refers to devices that register clients and servers, manage to conduct tests, collect results and act as a central server where other devices communicate anything related to test parameters. Clients are devices that conduct the throughput, latency, and RTT tests with another end device. Servers are end devices that act as the receiver or reflector for measuring network health. The tests are conducted from the client to the server, either from the client interactive shell based on demand or from the central server using a configuration json/psconfig web admin GUI.
PerfSONAR can be installed in CentOS or Ubuntu based Linux environments. The various offerings are,
Figure 2 below explains the bundle options,
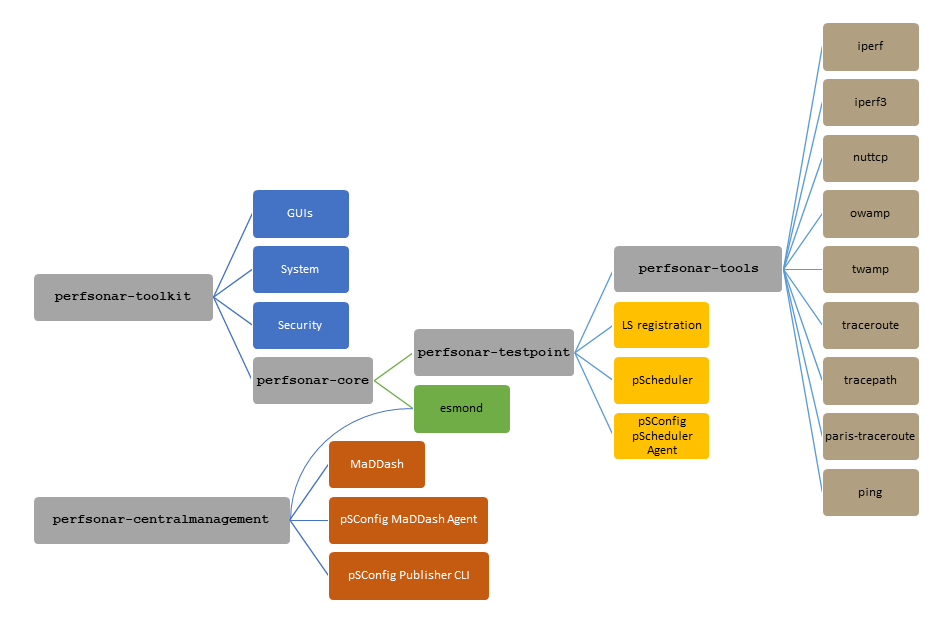
We can run network measurement tests in two different modes.
Once the scheduled tests are completed, results ae published to the central management server archiver, which is picked up by the maddash agent and visualizations are generated. Any present issues can be detected by observing the graphs and charts data, drawn up by the maddash agent.
Twping hosted by TWAMP (Two-Way Active Measurement Protocol) is a tool used to generate IP performance metrics between a client and server device by using two-way or round-trip tests. TWAMP is a development from the OWAMP (One-Way Active Measurement Protocol) method. TWAMP uses four entities in the topology, control-client and session-sender packaged into the client device and session-reflector and the server are packaged into the server device.
Initially, a TCP socket connection is established between the client and server in the TWAMP dedicated TCP port 862, after which the server sends a greeting message, that contains the security authentication modes supported by the server. Upon receiving the greeting message, the client sends the test conditions and the client information on which IP of the server device the test packets will be sent to. If the server agrees to conduct the described tests, the test begins as soon as the client sends a Start-Sessions or Start-N-Session message. This process is referred to as a twamp-control process
As part of a test, the server sends a stream of UDP-based test packets to the server, and the server responds to each received packet with a response UDP-based test packet. When the client receives the response packets from the session-reflector, the information is used to calculate two-way delay, packet loss, and packet delay variation between the two devices.
The user is provided with an option to bypass the TWAMP control process and conduct a TWAMP-light test. In a TWAMP-light test, the entities present are only the session sender and the session reflector. The initial TCP connection between the server and client is bypassed and only the stream of UDP-based test packets is sent and received by the client. But to run a TWAMP-light test, the server IP and the UDP port which will reflect the TWAMP packets, needs to be added as a part of the reflector configuration in the server. The client that runs a TWAMP-light test, will need to send the UDP packets to this configured IP and UDP port, failing which will result in the sent packets being dropped and loss of test metrics.
Figure 3 and 4 show the TWAMP and TWAMP-light protocol components
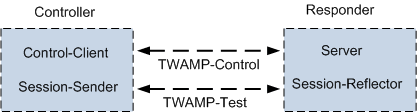
Figure 3 – TWAMP
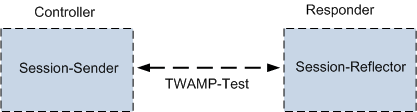
Figure 4 – TWAMP-light
Building a data center is not what it used to be. Servers, VMs, networking fabrics-these are no longer…
Read More
The Next Evolution in SONiC Intelligence At PalC Networks, our work with SONiC has always been about more…
Read More
The Shift Toward Reasoning Networks Every evolution in networking has pursued one goal which is reducing human friction.From…
Read MoreNext steps
Talk to an Infrastructure Expert to discuss how PalC can help you build production-grade, open networking solutions.
Connect with our experts to discuss your network modernization, SONiC deployment, or AI infrastructure needs.
Tell us about your infrastructure challenges and we'll connect you with our experts.