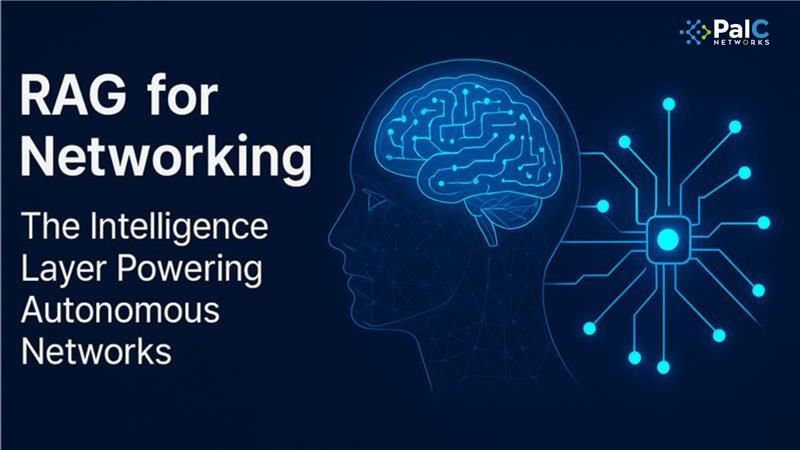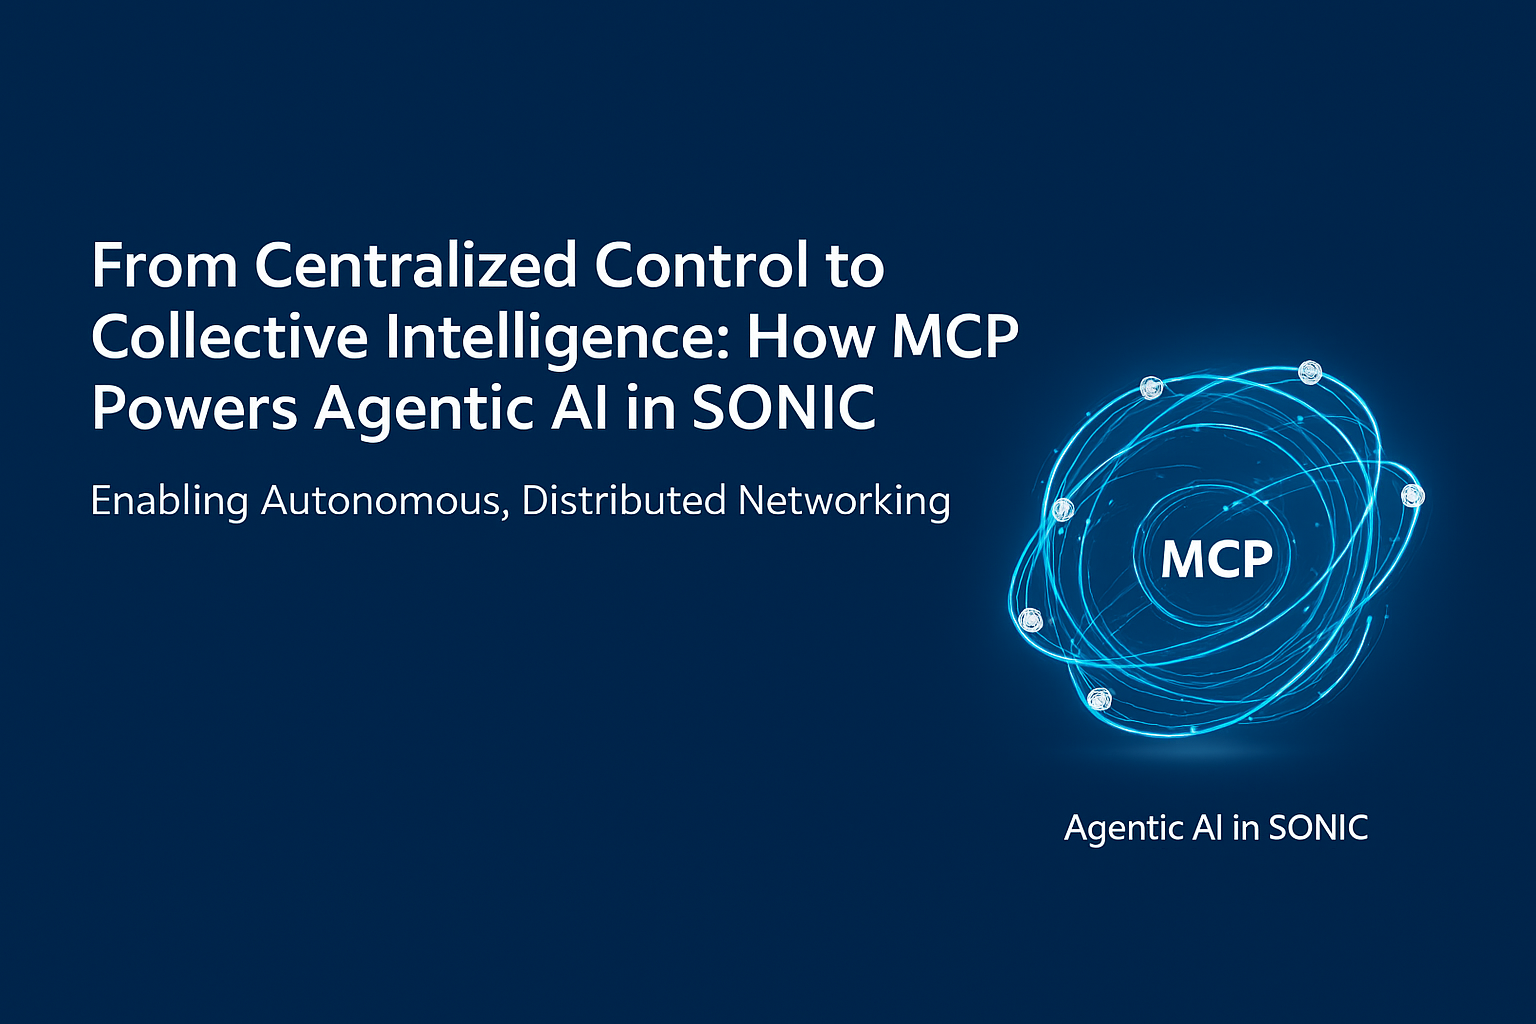
The Next Evolution in SONiC Intelligence
At PalC Networks, our work with SONiC has always been about more than automation.
Automation is efficient but it’s still reactive.
What we wanted was awareness: A network that could interpret, coordinate, and adapt.
That idea took form through Agentic AI: a framework where SONiC’s critical functions (configuration, telemetry, topology, security) are handled by specialized, intelligent agents.
But as we scaled, one challenge became clear: Intelligence, if isolated, becomes another form of silo.
Each agent could perform brilliantly on its own, but real autonomy requires more, A shared consciousness.That’s where the MCP (Multi-Agent Coordination Plane) comes in.
It’s the layer that turns multiple intelligent agents into a cooperative, adaptive ecosystem.
From Orchestration to Collaboration
Traditional orchestration relies on centralized control using one brain to manage the entire network.
Modern networks are organic with thousands of devices, millions of telemetry signals, and unpredictable traffic patterns.
Scaling intelligence doesn’t mean building a bigger brain. It means building many smaller ones where each one is capable of learning, reasoning, and collaborating.
That’s the foundation of MCP:
Every SONiC agent becomes an independent node that can:
- Understand its local state
- Exchange context with peers
- Coordinate decisions through the MCP layer
Together, they form a federation of specialized minds which means faster, more resilient, and inherently aware of the whole.
MCP Explained: The Missing Link Between Automation and Autonomy
The Multi-Agent Coordination Plane is a distributed intelligence fabric that connects multiple SONiC agents into one unified reasoning system.
In our Agentic AI architecture, MCP acts like a nervous system for the network:
- Each agent (Config, Telemetry, Topology, Security) behaves like a neuron.
- MCP is the synaptic layer that carries signals and aligns actions.
- Together, they create a collective intelligence becoming self-aware, self-optimizing, and contextually driven.
How MCP Works
1.Distributed Reasoning
Each agent monitors, configures, or optimizes within its domain, while MCP ensures a shared state across them.
2.Context Sharing
When telemetry flags congestion, MCP routes that insight to configuration and topology agents, prompting proactive adjustments.
3.Decision Synchronization
MCP prevents conflicting actions, ensuring coordinated, safe changes across agents.
4.Learning & Feedback
Over time, MCP identifies patterns in cause and effect, improving the network’s ability to predict and prevent disruptions.
Business Impact: Why MCP Matters for Enterprises
MCP is more of a business enabler than being an architectural improvement.
It turns reactive infrastructure into a self-optimizing system that saves time, cost, and risk.
| Enterprise Challenge | MCP Solution |
|---|---|
| Manual, reactive operations | Predictive, AI-driven coordination before failures occur |
| Configuration errors | Pre-validation, rollback, and cross-agent verification |
| Fragmented monitoring | Unified loop between telemetry, config, and topology |
| Scaling complexity | Distributed, localized decision-making for faster remediation |
| Compliance and audits | Built-in traceability for every autonomous action |
By distributing reasoning across nodes, MCP transforms the data center from an operational burden into resilient, compliant, and aware ecosystem.
Turning SONiC Agents into Collaborators
Here’s how collaboration unfolds inside PalC’s Agentic AI framework:
- Intent Interpretation: The orchestrator translates operator intent (e.g., “Deploy a 4-leaf, 1-spine fabric with telemetry enabled”).
- Delegation via MCP: Tasks are distributed into Configuration sets up interfaces, Topology maps links, Telemetry preps sensors.
- State Synchronization: Agents continuously share updates, ensuring decisions remain consistent and validated.
- Adaptive Execution: MCP learns from each event, fine-tuning coordination for future scenarios.
SONiC, through MCP, shifts from being managed to self-managing.
When Each Agent Thinks and Learns
Each agent grows smarter through experience:
- Config Agent: Learns from historical changes to suggest safer rollouts.
- Telemetry Agent: Detects patterns to predict congestion or performance drift.
- Topology Agent: Recalculates paths dynamically under load or failure.
- Security Agent: Applies policies based on live context, not static rules.
Through MCP, these agents share learning, building a network that’s intelligently aware.
| Traditional Automation | Agentic AI + MCP |
|---|---|
| Centralized control | Distributed coordination |
| Static rule execution | Context-aware reasoning |
| Manual incident handling | Autonomous self-healing |
| Configuration scripts | Intent-driven adaptability |
MCP turns SONiC fabrics into cooperative, evolving systems
PalC’s Vision: Engineering Distributed Autonomy
Our MCP framework fuses AI reasoning, SONiC’s openness, and operational discipline into a distributed, resilient control model.
The goal is to give networks the ability to handle complexity, so humans can focus on innovation.
The outcome:
- Networks that heal themselves.
- Operations that think in context.
- Infrastructure that acts with intent.
Key Takeaways
MCP (Multi-Agent Coordination Plane) enables real-time coordination among SONiC agents.
Agentic AI transforms SONiC from automated to intelligent.
PalC Networks delivers the engineering and ecosystem to make open autonomy practical.
The result: open, intelligent, business-aware data centers built for the future.