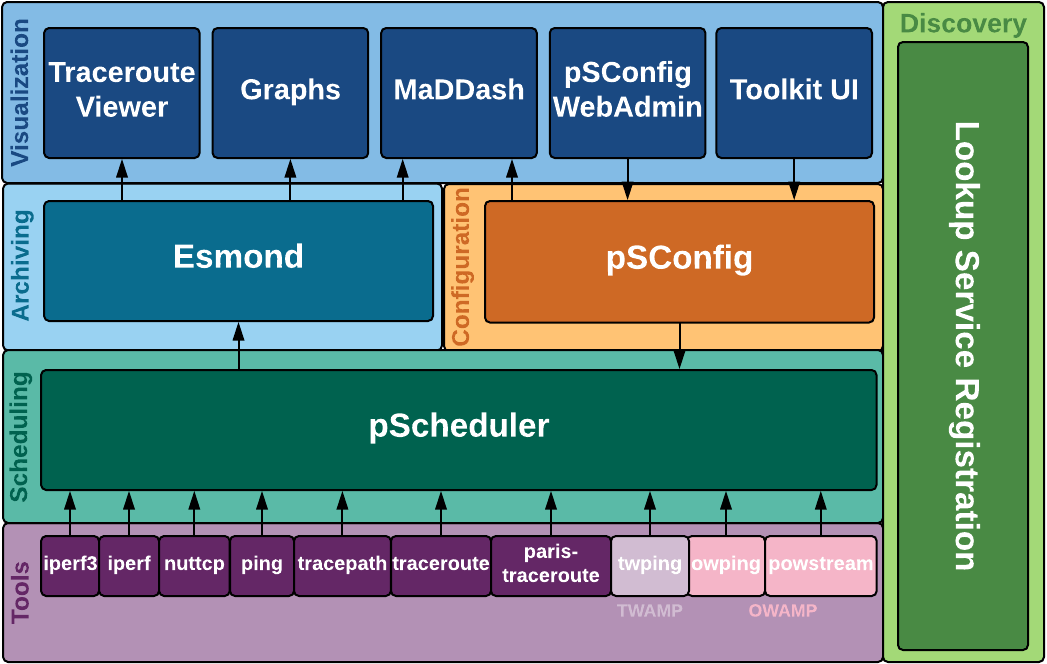
Figure 1 – perfSONAR architecture
In the architecture diagram (Figure 1) mentioned above, the key components have been outlined below:
- perfsonar tools – This module contains different utilities responsible for carrying out the actual network measurements. Twamp tool consists of twping binary which is used on client side and twampd binary which runs on the server/responder side. Similarly, we have owamp, powstream, traceroute, tracepath, paris-traceroute and other diagnostic methods. We can use these tools for measurement of following performance metrics.
- Latency – measuring one-way and two-way delays
- Packet loss, duplicate packets, jitter
- Tracing network path
- Trace path – Identifying the path MTU
- Throughput – Measuring the bandwidth availability
An overview of supported tools –
- owamp – A set of tools primarily used for measuring packet loss and one-way delay. It includes the command owping for single short-lived tests and the powstream command for long-running background tests.
- twamp – A tool primarily used for measuring packet loss and two-way delay. It has an increased accuracy over tools like ping without the same clock synchronization requirements as OWAMP. The client tool is named twping and can be used to run against TWAMP servers. You can use the provided twampd server or many routers also come with vendor implementation of TWAMP servers that can be tested against.
- iperf3 – A rewrite of the classic iperf tool used to measure network throughput and associated metrics.
- iperf2 – Also known as just iperf, a common tool used to measure network throughput that has been around for many years.
- nuttcp – Another throughput tool with some useful options not found in other tools.
- traceroute – The classic packet trace tool used in identifying network paths
- tracepath – Another path trace tool that also measures path MTU
- paris-traceroute – A packet trace tool that attempts to identify paths in the presence of load balancers
- ping – The classic utility for determining reachability, round-trip time (RTT), and basic packet loss.
- pScheduler – The pScheduler is responsible for scheduling the tests based on user configuration and available time slots on the machine. It finds time-slots to run the tools while avoiding scheduling conflicts that would negatively impact results, Executing the tools and gathering results, and send the results to the configured archiver
- Archiving – This module contains the esmond component which stores the measurement information for the tests run. It is often referred to as the measurement archive (MA) and the term is used interchangeably with esmond. Esmond can be installed in each end device, or in the central server device which collects all test results.
- Psconfig pscheduler agent – This module will get the user configurations from a file in json format and then use it to communicate with the pScheduler to schedule the tests.
- Psconfig maddash agent – The agent responsible for reading the same configuration json file and creating graphs and charts based on the conducted test results.
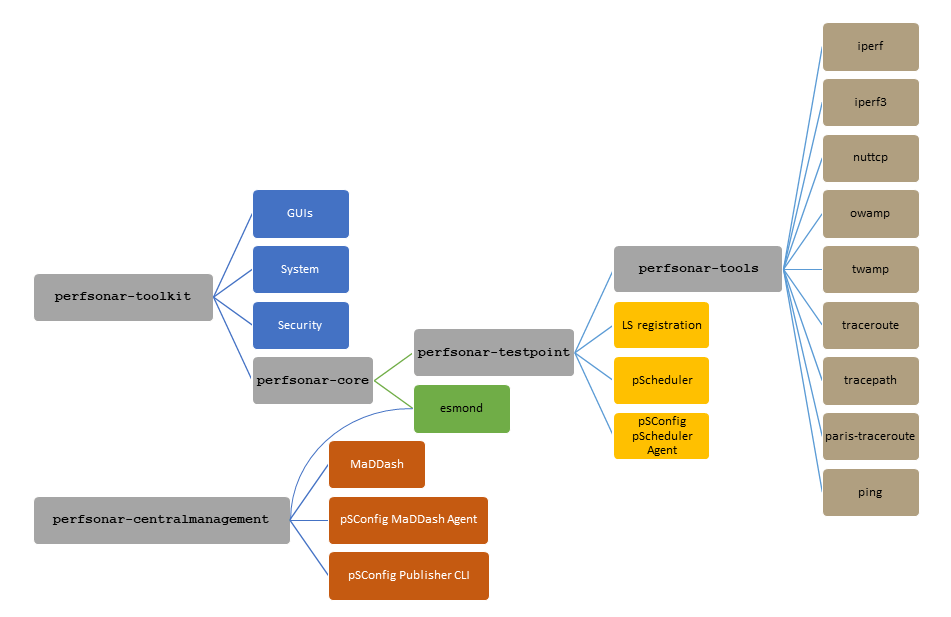
The user has different installation options for different end devices such as centralized servers, clients, and servers. Here centralized server refers to devices that register clients and servers, manage to conduct tests, collect results and act as a central server where other devices communicate anything related to test parameters. Clients are devices that conduct the throughput, latency, and RTT tests with another end device. Servers are end devices that act as the receiver or reflector for measuring network health. The tests are conducted from the client to the server, either from the client interactive shell based on demand or from the central server using a configuration json/psconfig web admin GUI.
PerfSONAR can be installed in CentOS or Ubuntu based Linux environments. The various offerings are,
- Perfsonar-tools – This package installs only the command line binaries needed to run on-demand tests such as iperf, iperf3 and owamp. Often used for debugging network disruptions rather than for dedicated monitoring of network.
- Perfsonar-testpoint – This package contains command-line binaries to run on-demand tests, in addition to tools to scheduling of tests conduct tests based on central server instructions in json files, and participate in node discovery conducted in central servers. But this package lacks software to store measurement data in a local archive.
- Perfsonar-core – This package is dedicated for devices that run tests themselves, instruct others to run the tests and store measurement data themselves.
- Perfsonar-toolkit – This package includes everything present in perfsonar-core including the web-admin to conduct tests via GUI.
- Personar-centralmanagement – This package is installed in central management servers that instruct others to run tests and manage a number of hosts, while also being able to retrieve and archive the test results from a number of hosts.
Figure 2 below explains the bundle options,
We can run network measurement tests in two different modes.
- Full mesh mode – where all the perfsonar hosts in the network are involved in running the tests to each other, essentially all the hosts should be running perfSONAR
- Disjoint mode – where the tests are run from one set of perfsonar hosts to another set of hosts (these hosts can be other 3rd party devices as well)
Once the scheduled tests are completed, results ae published to the central management server archiver, which is picked up by the maddash agent and visualizations are generated. Any present issues can be detected by observing the graphs and charts data, drawn up by the maddash agent.
TWAMP and TWAMP-light
Twping hosted by TWAMP (Two-Way Active Measurement Protocol) is a tool used to generate IP performance metrics between a client and server device by using two-way or round-trip tests. TWAMP is a development from the OWAMP (One-Way Active Measurement Protocol) method. TWAMP uses four entities in the topology, control-client and session-sender packaged into the client device and session-reflector and the server are packaged into the server device.
Initially, a TCP socket connection is established between the client and server in the TWAMP dedicated TCP port 862, after which the server sends a greeting message, that contains the security authentication modes supported by the server. Upon receiving the greeting message, the client sends the test conditions and the client information on which IP of the server device the test packets will be sent to. If the server agrees to conduct the described tests, the test begins as soon as the client sends a Start-Sessions or Start-N-Session message. This process is referred to as a twamp-control process
As part of a test, the server sends a stream of UDP-based test packets to the server, and the server responds to each received packet with a response UDP-based test packet. When the client receives the response packets from the session-reflector, the information is used to calculate two-way delay, packet loss, and packet delay variation between the two devices.
The user is provided with an option to bypass the TWAMP control process and conduct a TWAMP-light test. In a TWAMP-light test, the entities present are only the session sender and the session reflector. The initial TCP connection between the server and client is bypassed and only the stream of UDP-based test packets is sent and received by the client. But to run a TWAMP-light test, the server IP and the UDP port which will reflect the TWAMP packets, needs to be added as a part of the reflector configuration in the server. The client that runs a TWAMP-light test, will need to send the UDP packets to this configured IP and UDP port, failing which will result in the sent packets being dropped and loss of test metrics.
Figure 3 and 4 show the TWAMP and TWAMP-light protocol components


